The Dashboard
The Dashboard is mission control: host CPU, memory and disk, what is running right now, and recent activity. Metrics are built in - no external monitoring stack to set up.
Host gauges show live CPU, RAM and disk for the machine running your labs - if a big QEMU lab will not fit, you see it here first. Below, running labs and their node counts.
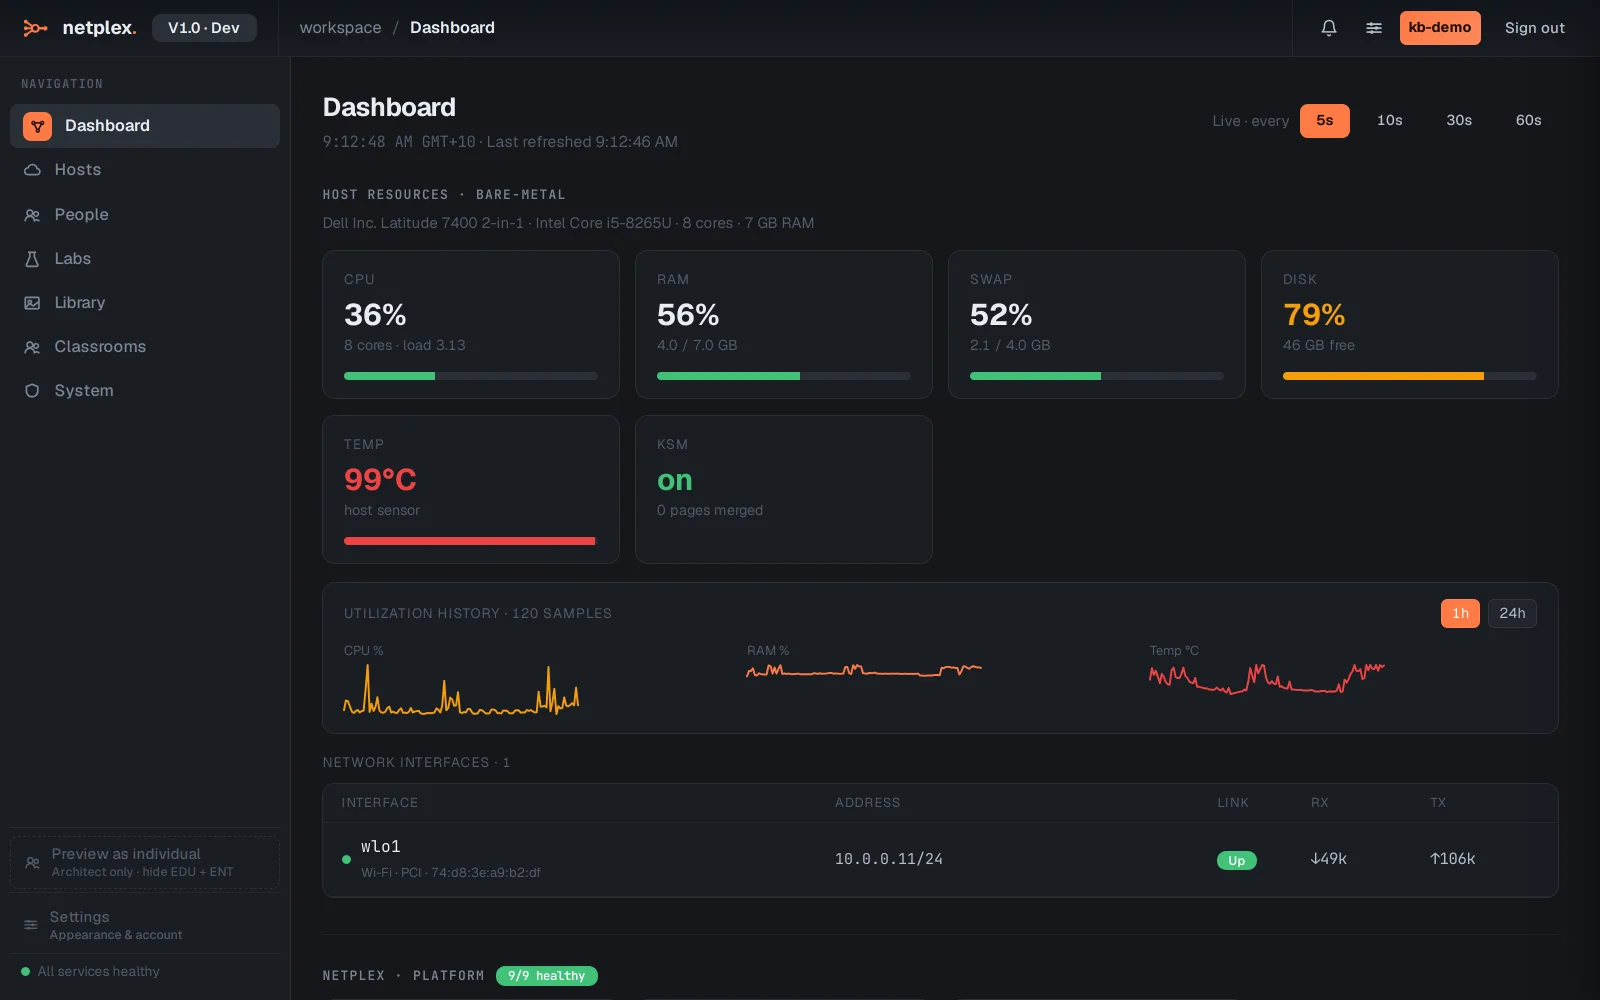
The bell in the top bar collects notifications - host pressure warnings, lab events, update notices. Style what the Dashboard shows under Settings → Dashboard Appearance.
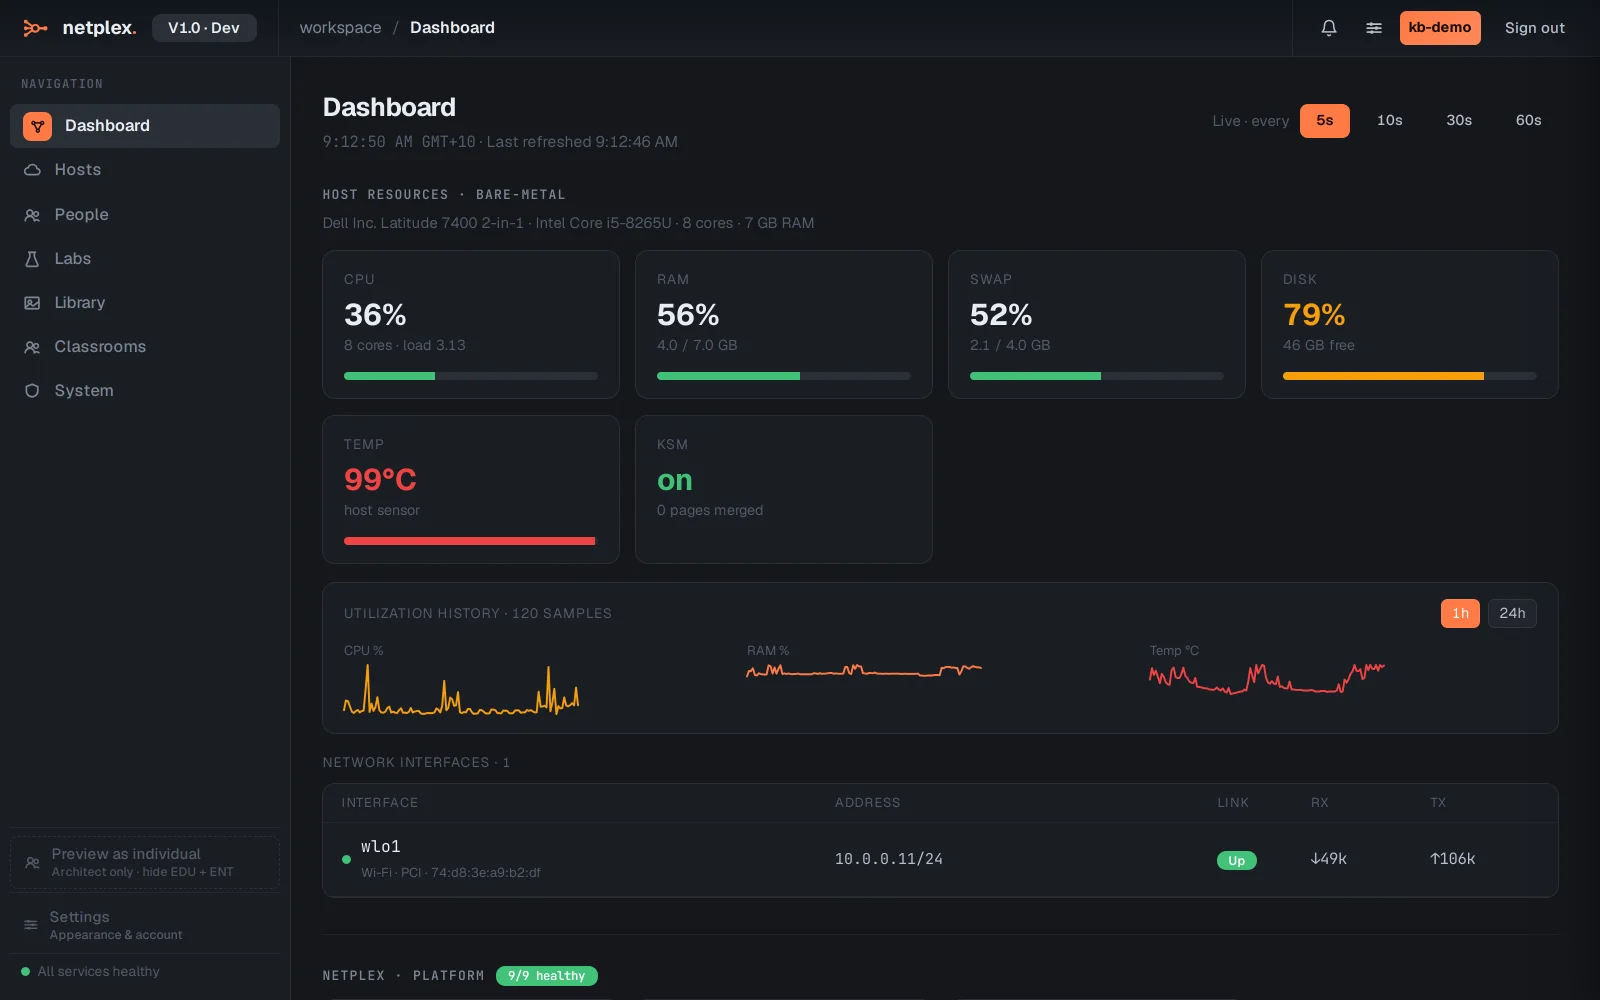
Inside a lab, the same telemetry appears per node (Inspector → Metrics) and per link (select a link) - the Dashboard is the whole-host view of the same data.