The node Inspector
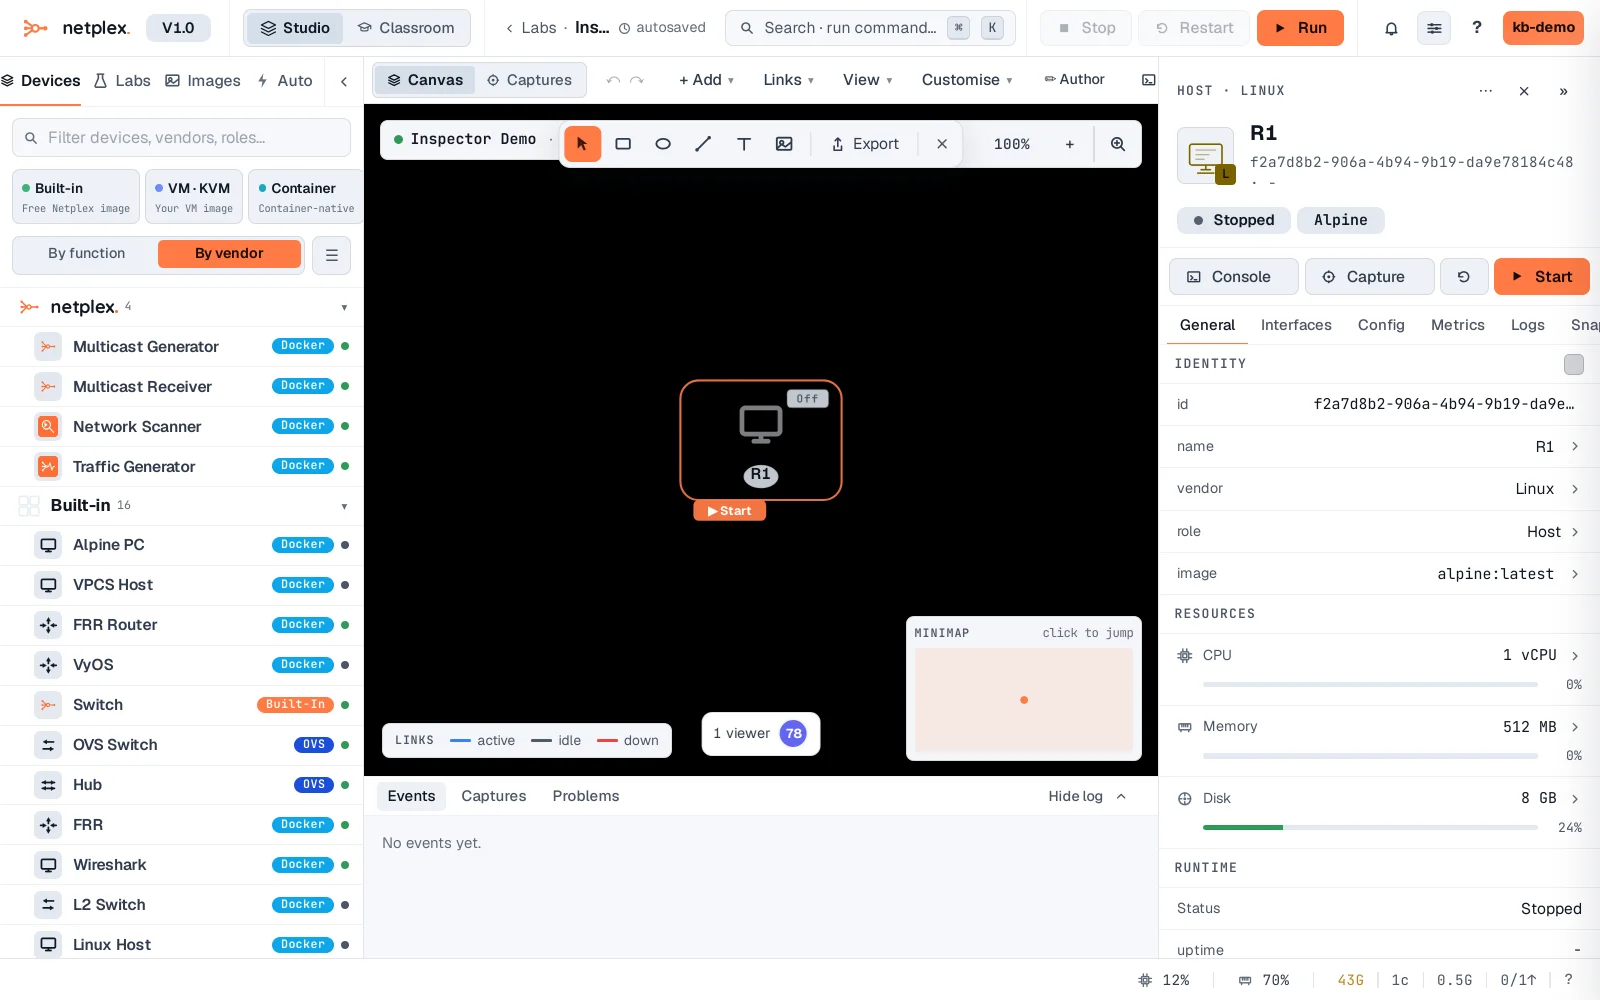
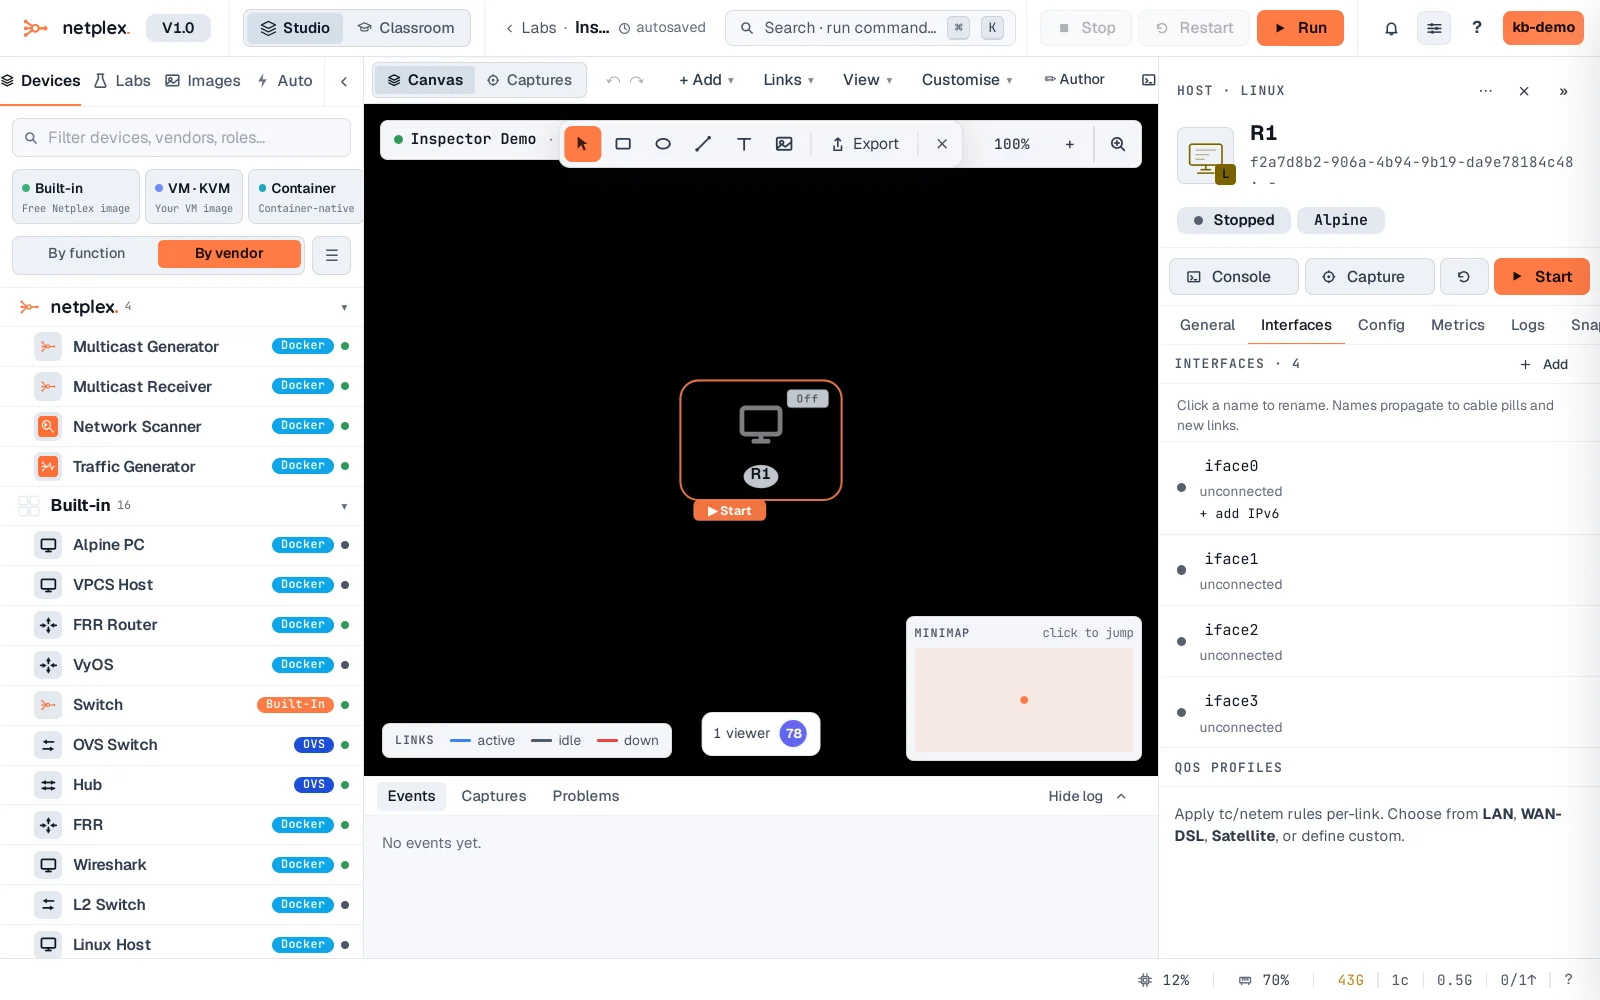
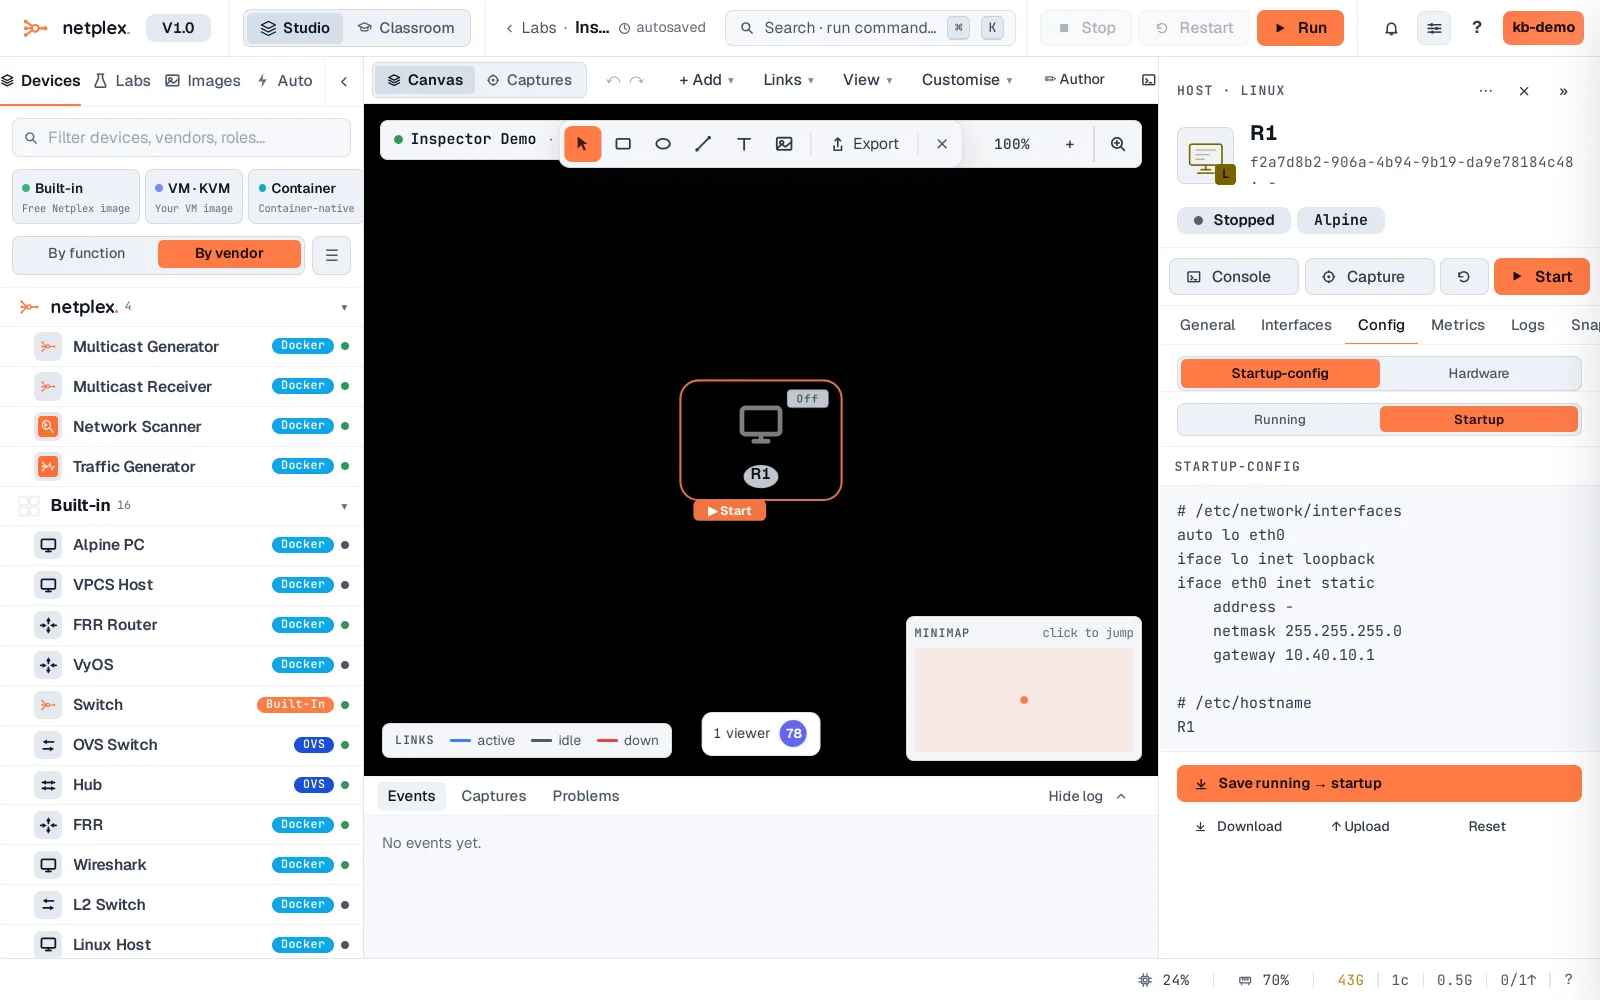
Click any node and the Inspector on the right becomes its control panel. Everything about one device lives here, split into tabs: General (identity + hardware), Interfaces, Config, Metrics, Logs and Snapshots.
Select a node. General shows its identity, image and hardware - CPU, RAM and interface count are editable while the node is stopped.
Interfaces lists every port with its link state - which interface is wired to which neighbour, and which are still free.
The remaining tabs come alive when the node runs: Metrics (live CPU/RAM), Logs (console output), Config (startup configuration) and Snapshots (point-in-time saves you can roll back to).
The Inspector always reflects the selected element - selecting a link instead shows the link's properties and QoS. Click empty canvas to deselect.