Node logs and live metrics
Running nodes stream their telemetry into the Inspector: Logs shows the node's output (boot messages, daemons, crashes), Metrics its live CPU and memory. Both are per node - select a device to see its own story.
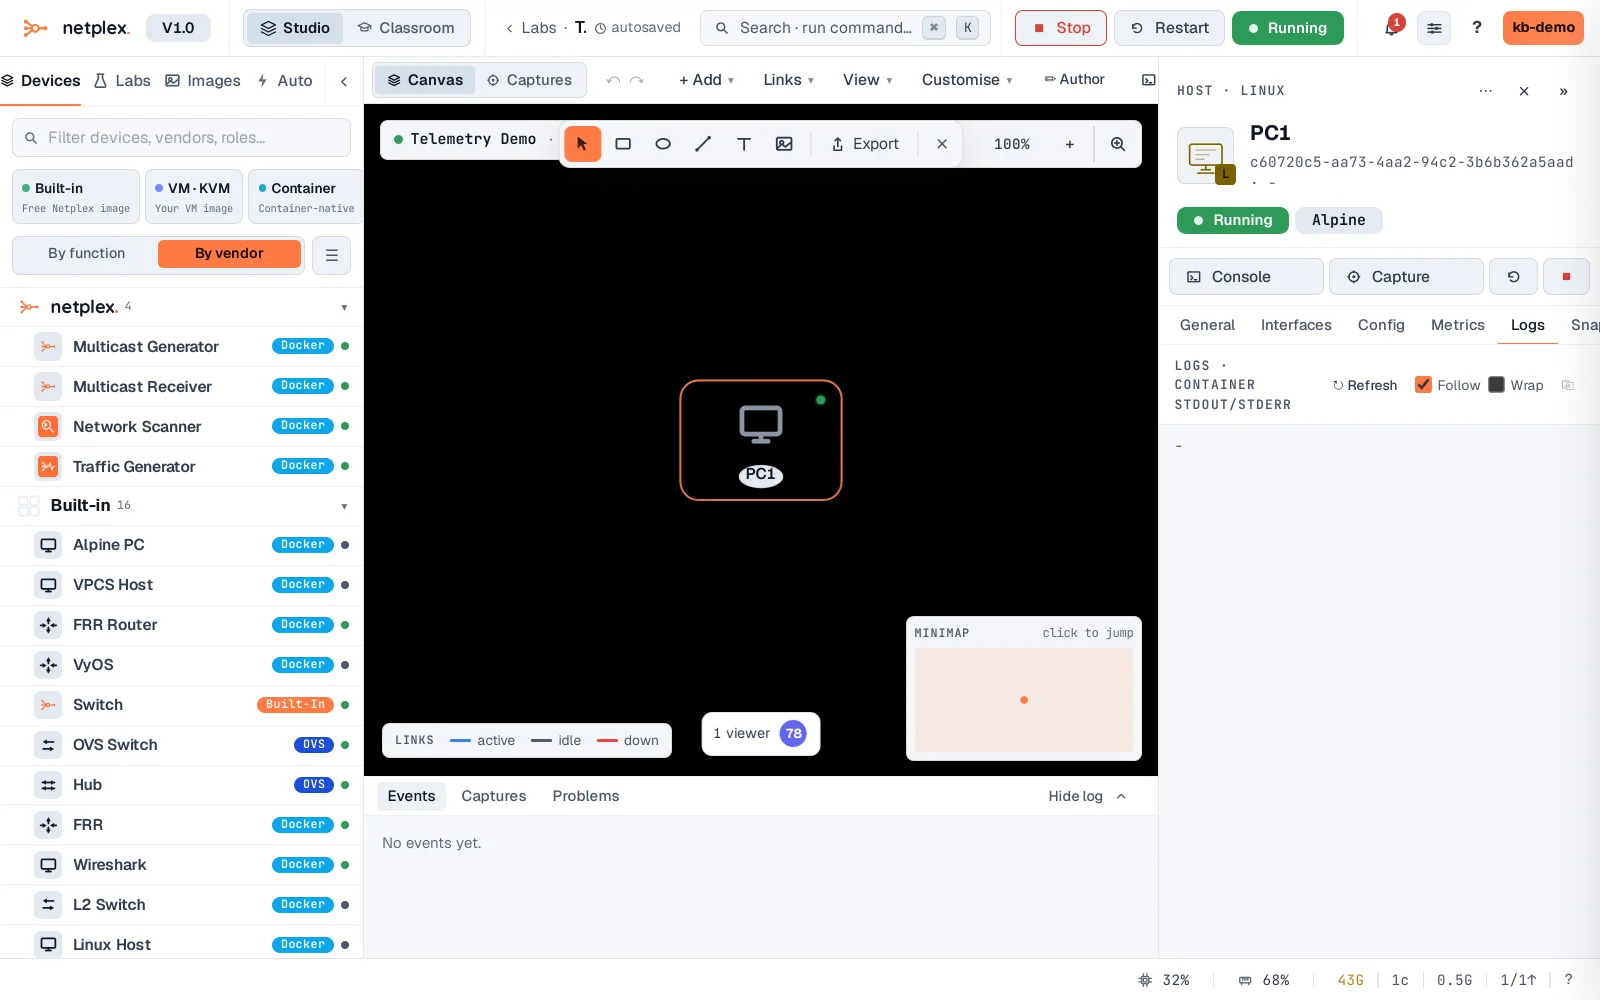
Select the running node and open the Logs tab - the node's console output, live. This is the first place to look when a node boots but does not behave.
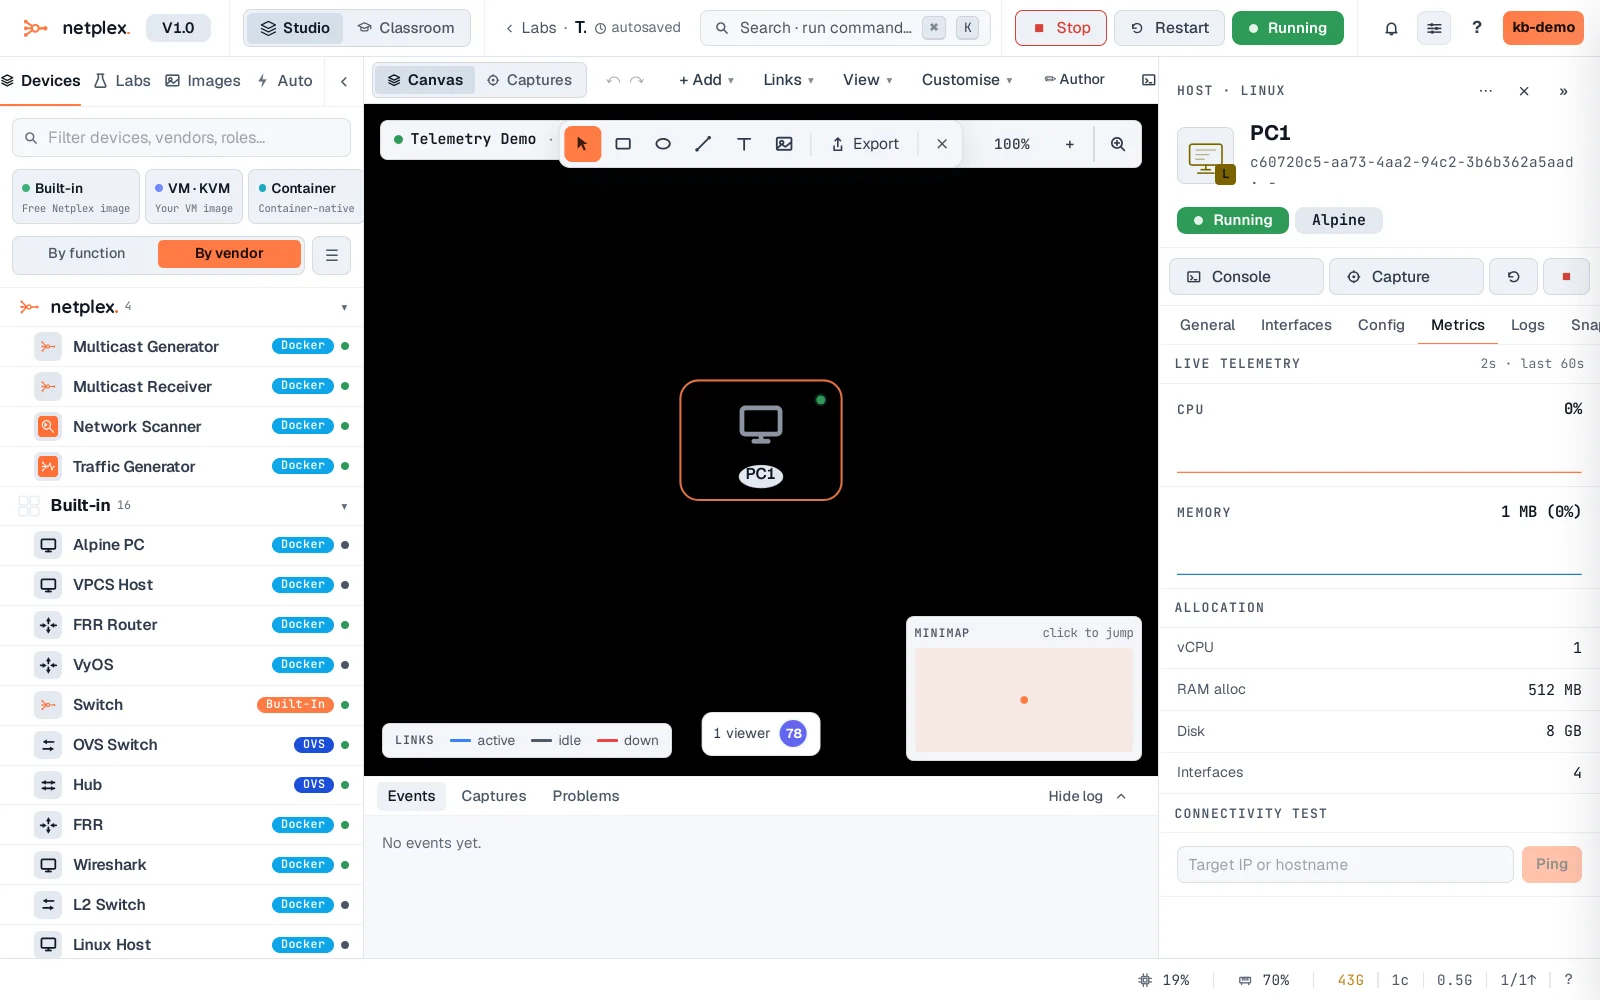
Metrics charts the node's CPU and memory in real time - spot a router pegging a core or a VM about to hit its RAM ceiling before it falls over.
Host-level metrics (all labs together) live on the Dashboard. If a node needs more resources, stop it, raise CPU/RAM on the General tab, start again.