Read the event log
The bar along the bottom of the Studio is an activity log. As you build a lab, every action is recorded with a timestamp - a device added, a link drawn, connectivity turned on, the canvas locked. It is your paper trail: what changed, and when.
Do something on the canvas - here, draw a link between the two PCs. The moment you do, a link.created line appears in the Events log at the bottom, timestamped.
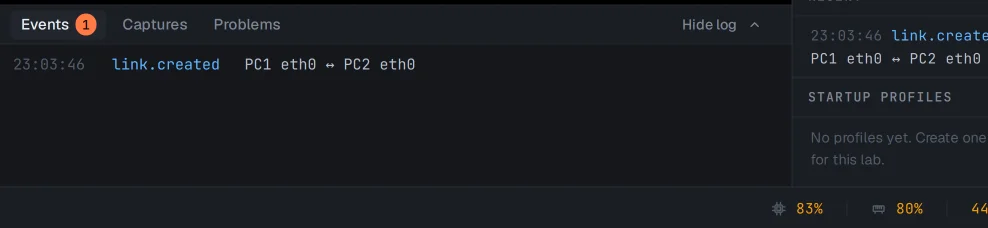
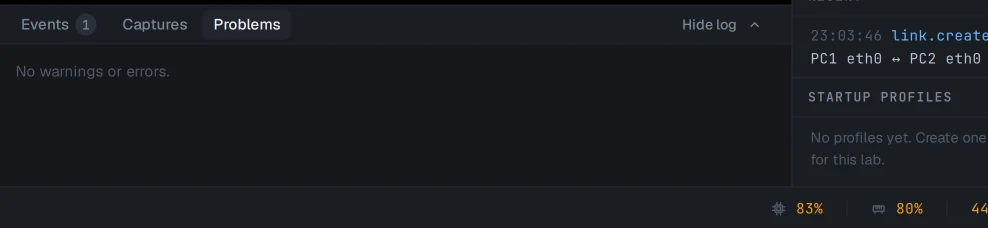
Every action lands here - add a device, apply connectivity, lock the canvas - so you can retrace exactly how a lab reached its current shape. The Problems tab filters the same stream down to just warnings and errors.
The log holds the most recent activity for the lab you are in. For platform-wide history across every lab - service logs, updates, node lifecycle - the System page (admins) and the Dashboard are the wider view.