Reading the host resource cards
The Dashboard's host cards are the machine's real vitals - CPU, RAM, disk and (where a sensor exists) temperature - each colour-coded amber past 75% and red past 90%, so a lab that is about to run the box out of headroom is visible before it happens, not after.
CPU and RAM show percentage plus the raw numbers underneath (core count and load average for CPU; used/total GB for RAM). Disk shows free space directly, since "how much is left" matters more than the percentage once a box is mostly full.
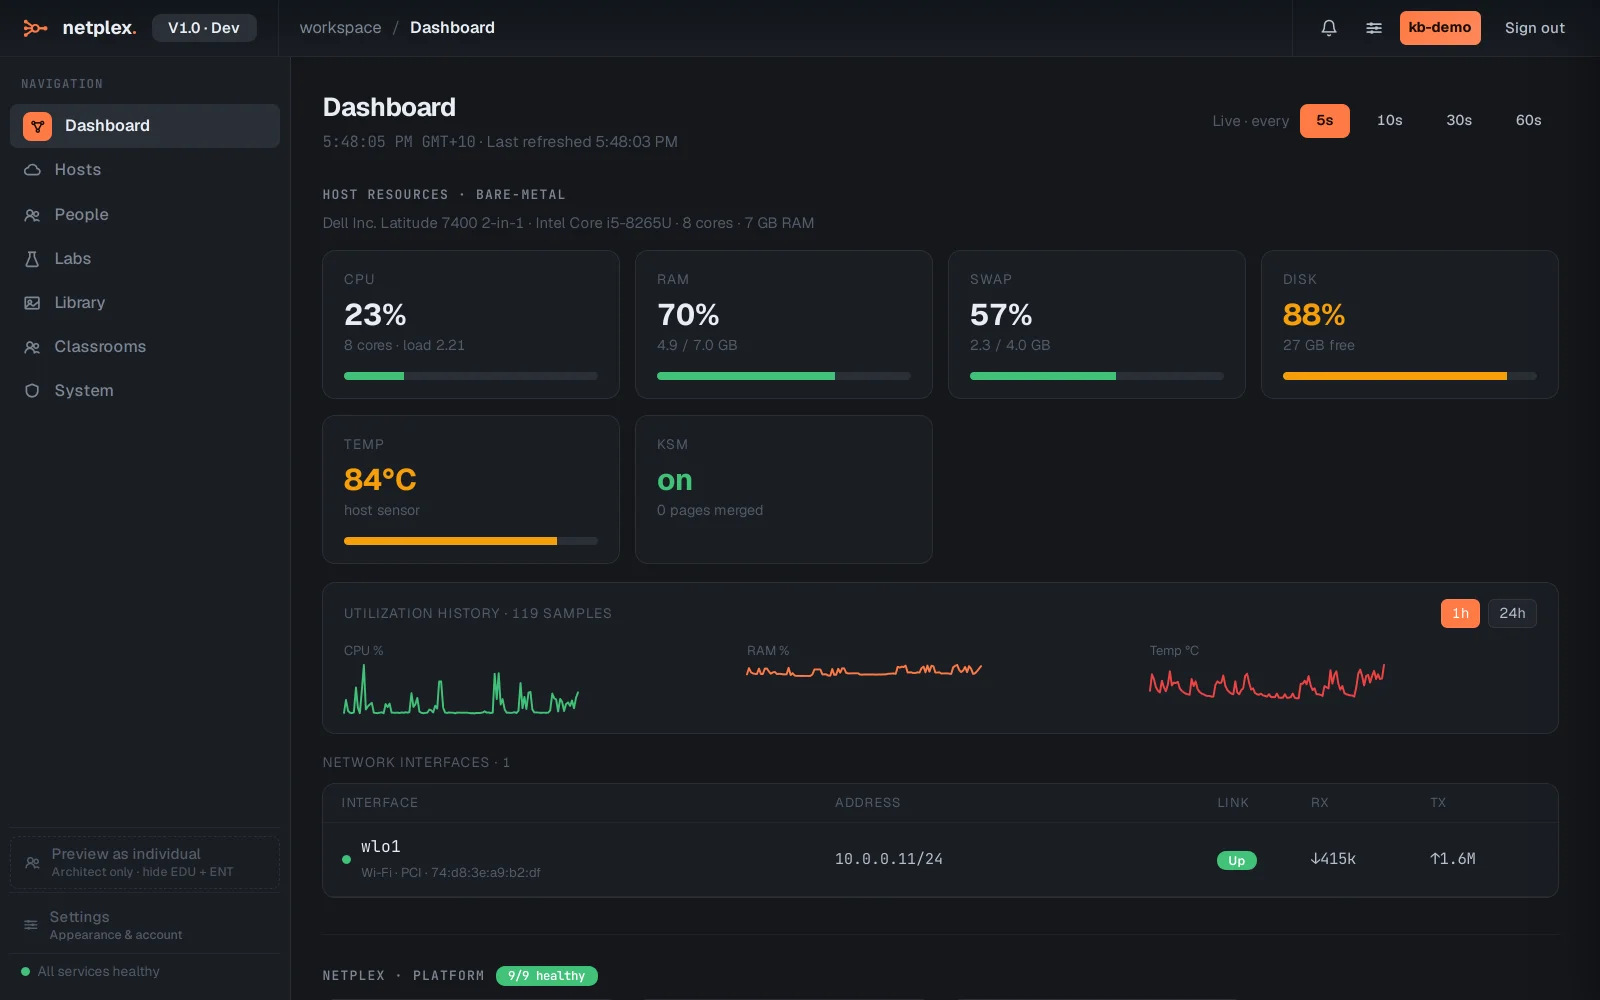
Below the cards, sparklines chart CPU and RAM over time once enough samples exist - a slow climb toward capacity reads very differently from a spike, and the sparkline is what tells them apart.
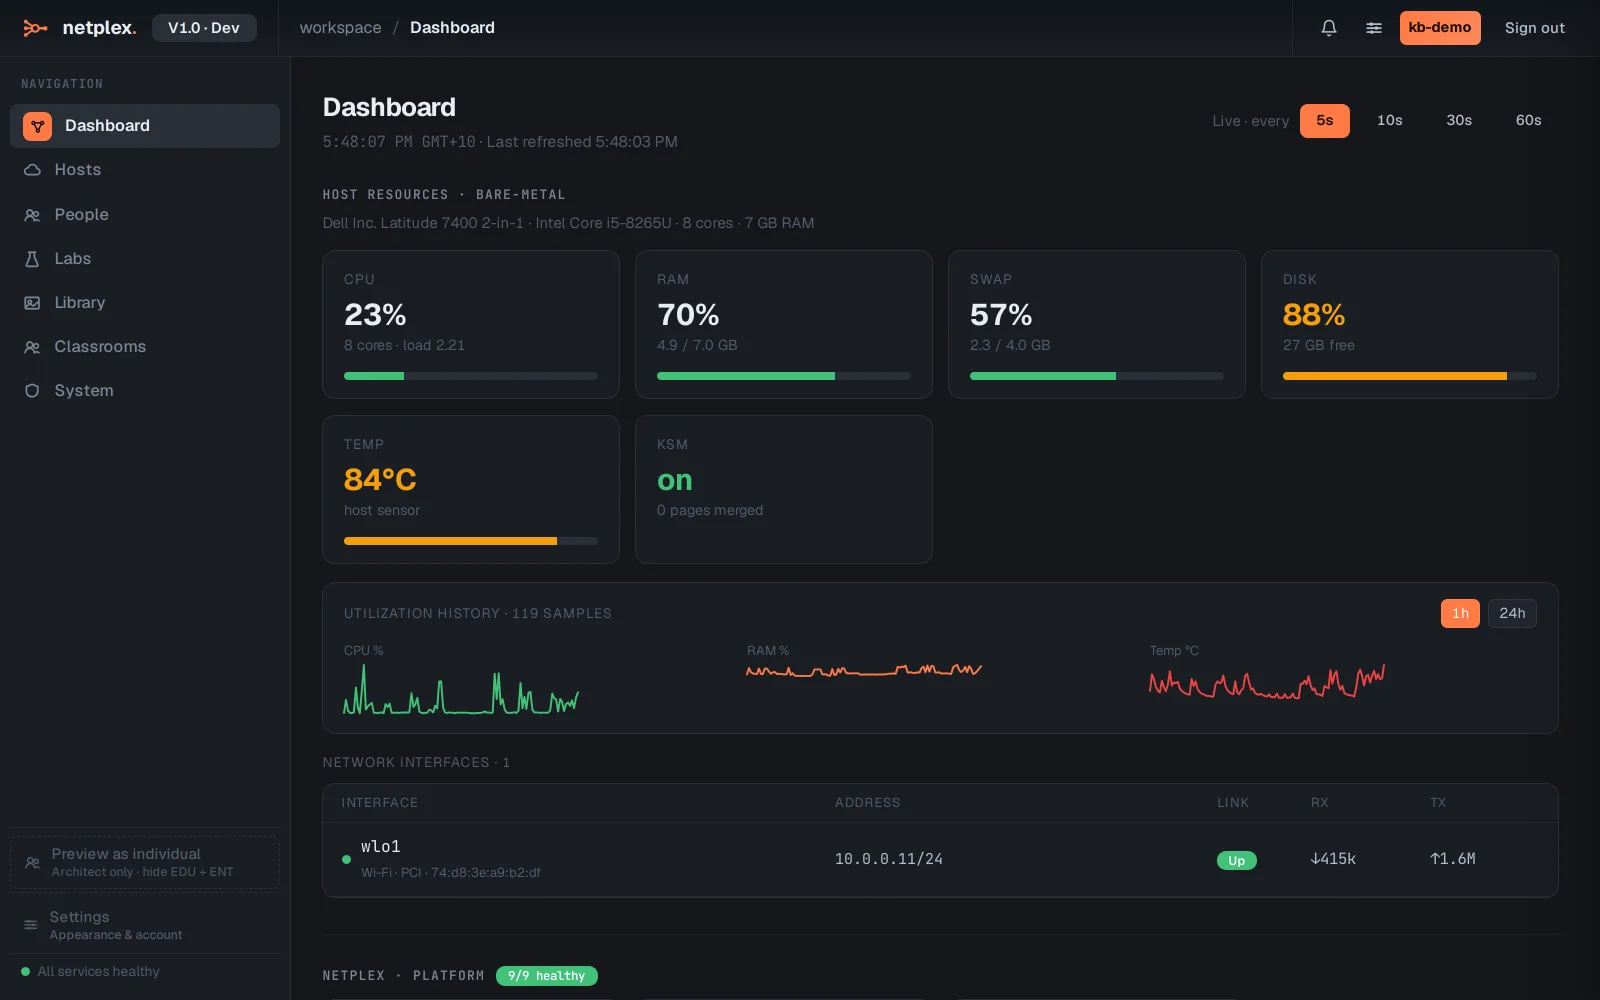
A Temp card only appears if the host exposes a sensor NetPlex can read, and Swap/KSM cards only appear when the host actually has swap configured or KSM enabled - all three are omitted rather than shown as zero on a box without them. See "The Dashboard" for the wider page these cards live on, and "Per-lab resource usage" for the same kind of numbers scoped to one lab instead of the whole host.