Per-lab and per-node resource usage
The host gauges on the Dashboard show the whole machine; the lab navigator below them drills down to one lab at a time - click it on the left, and every node's live CPU, RAM (in-use vs. provisioned), network and uptime shows up on the right.
Open the Dashboard and filter the lab list to find it - clicking a lab loads its nodes on the right, each with live CPU, RAM and network figures rather than a single lab-wide total.
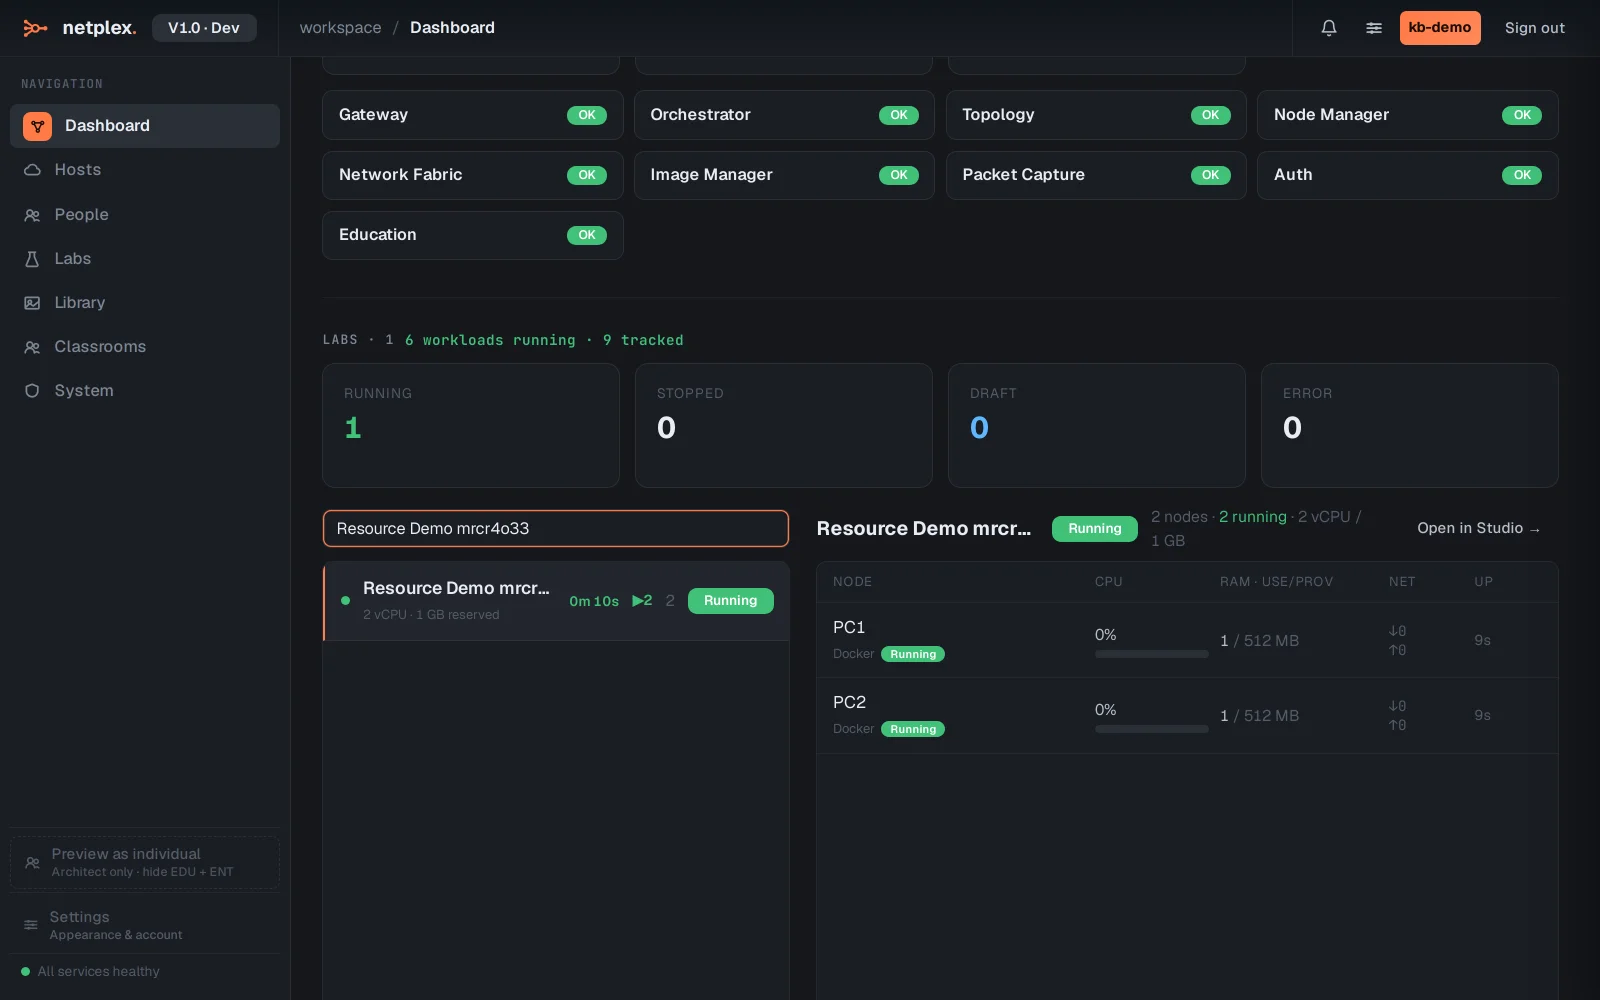
Numbers here are live - refresh interval is adjustable (5/10/30/60s) at the top of the page. For the whole-machine view this drills down from, see "The Dashboard" tour; for a longer trend instead of a live snapshot, the host card above this navigator keeps a 1h/24h utilisation history once enough samples have accumulated.